Press Releases


13th May 2022
Green NCAP LCA Update
Green NCAP’s Life Cycle Analysis (LCA) is intended to provide objective, unbiased information about the greenhouse gas emissions and primary energy demand of modern vehicles. It is a way of comparing the overall impact that the car will have on climate-changing emissions during its construction, its use and, ultimately, its end of life dismantling/recycling. Great strides have been made in recent years to refine such analyses, but LCA remains an area where certain assumptions and estimations have to be made. Accordingly, Green NCAP does not use LCA to rank cars, and information is provided for information only.
Unfortunately, an error has been identified in the LCA results published on 21 April 2022. For pure electric and electrified cars, the mass of the battery (and, therefore, its impact on greenhouse gases and primary energy demand related to vehicle production) was included in the overall mass of the vehicle. However, it was also considered as a separate item contributing to the global warming and energy demand effects associated with battery production. This over-estimated the emissions created during vehicle production, and less significantly those of maintenance and recycling, and eventually increased the overall life cycle emissions of plug-in hybrids, fuel-cell cars and, most significantly, pure electric vehicles. This error has now been corrected. Most of the broader conclusions of the original analysis are unaffected but the benefits, in most circumstances, of electric vehicles over conventional, combustion-engined cars are now clearer.
For more detailed technical explanations see “Expert Notification”, published by JOANNEUM RESEARCH.
21ST APRIL 2022
LCA: How Sustainable is Your Car?
Green NCAP announces its first Life Cycle Assessment (LCA) results, examining the real environmental impact of some of Europe’s most popular cars in order to help car buyers make more informed and sustainable choices.
To understand the true ecological impact and sustainability of a car, it must be viewed in the context of its whole life cycle. This means that all processes and flows of resources and energy associated with the car’s production, usage, and recycling must be considered. Life Cycle Assessment, or LCA, is the method that estimates these individual contributions to predict the car’s environmental impact over its entire lifetime ‘from cradle to grave’.
Green NCAP’s Life Cycle Assessment involves estimations based on the available data and state-of-the-art scientific methodology, developed by JOANNEUM RESEARCH and peer-reviewed by the Paul Scherrer Institute. A unique feature of our approach is the use of realistic, comprehensive, and precise vehicle measurements to estimate the impact of the vehicle’s use phase. The average, best and worst measured fuel and energy consumptions from Green NCAP's tests serve as input data for the LCA calculations, revealing the potential effect of driving style and ambient conditions on the LCA results. Beside vehicle test data, the LCA methodology includes the forecast about changing electricity mix in various countries and the estimated evolution of the energy supply for the next two decades. Green NCAP’s Life Cycle Assessment hence sets the stage for the first true long-term harmonised vehicle LCA platform for the European market.
To demonstrate the value of the LCA approach, Green NCAP has calculated the estimated total life cycle greenhouse gas emissions and primary energy demand for the 61 recent cars tested in the programme in the period 2019-2021. This batch includes vehicles of all sizes and types, including conventional petrol and diesel, full-electric and hybrid-electric cars. For the comparative analysis, a nominal vehicle lifetime of 16 years and a total driven mileage of 240,000 km are assumed. The calculations are based on the current forecast about changing average energy of the 27 European Union member states and the United Kingdom, cancelling out the effect that local energy supply has on the cars’ LCA values. For each model, the transportation process flow and the output are summarised in a LCA factsheet.
Overall, the results show that total estimated greenhouse gas emissions and primary energy demand, and the respective contributions at different phases and time in the life cycle, may vary significantly depending on the propulsion system, the energy carrier and other factors. For conventional vehicles, the burning of fossil fuel during the operational phase accounts for most of the life cycle emissions and energy demand. This is different for electric cars for which the production phase on average accounts for a larger share of the total, while emissions in usage can vary depending on the portion of energy from non-renewable sources in the electricity used for charging. Electric cars have zero local greenhouse gas emissions and show overall the best LCA numbers in the European average. Not every car of the same powertrain type is equal too: the LCA analysis clearly shows that the impact of vehicle mass and size remains significant for all vehicle types. The same can be said about how cars are driven – relaxed or sporty. Additionally to optimizing their driving style, consumers that chose plug-in hybrid cars can help reduce the impact on the climate by making sure their cars are always fully charged.
While it is still too early to consider an all-encompassing star rating system based on LCA, the information provided underlines the importance of adopting a holistic approach towards the real life cycle environmental impact of modern cars and the role LCA will play in consumer information programmes.
Green NCAP makes its life cycle assessment details available for information purposes only, without ranking of better or worse cars. The next step, coming soon, is the launch of an interactive LCA platform, allowing consumers to examine LCA results based on their own local parameters and car use.
Finally, like any other LCA method, there are limitations to consider. With the impact on global warming and total primary energy demand, Green NCAP’s LCA accounts for the most relevant environmental aspects. However, other environmental effects of pollutant emissions like NOx, SO2, particulate matter and their consequential impacts like acidification, ozone formation, and toxicity to humans are not considered. The life cycle impact of a transport system on water demand, pollution of water or soil are also not included in the assessment yet.
The analysis is based on publicly available scientifically accepted information about vehicle production or recycling processes and does not consider specific data of single vehicle manufacturers or models. Some manufacturers may calculate results differently from the values estimated here using in-house data.
Editor’s note
Green NCAP is hosted and supported by the European New Car Assessment Programme
Follow us online and on social media:
LCA Results: A Closer Look
Example 1: Different powertrain types
Example 2: Vehicle mass
Example 3: Usage conditions
Example 4: Primary Energy Demand
Example 5: Electricity mix
Example 1: Different powertrain types
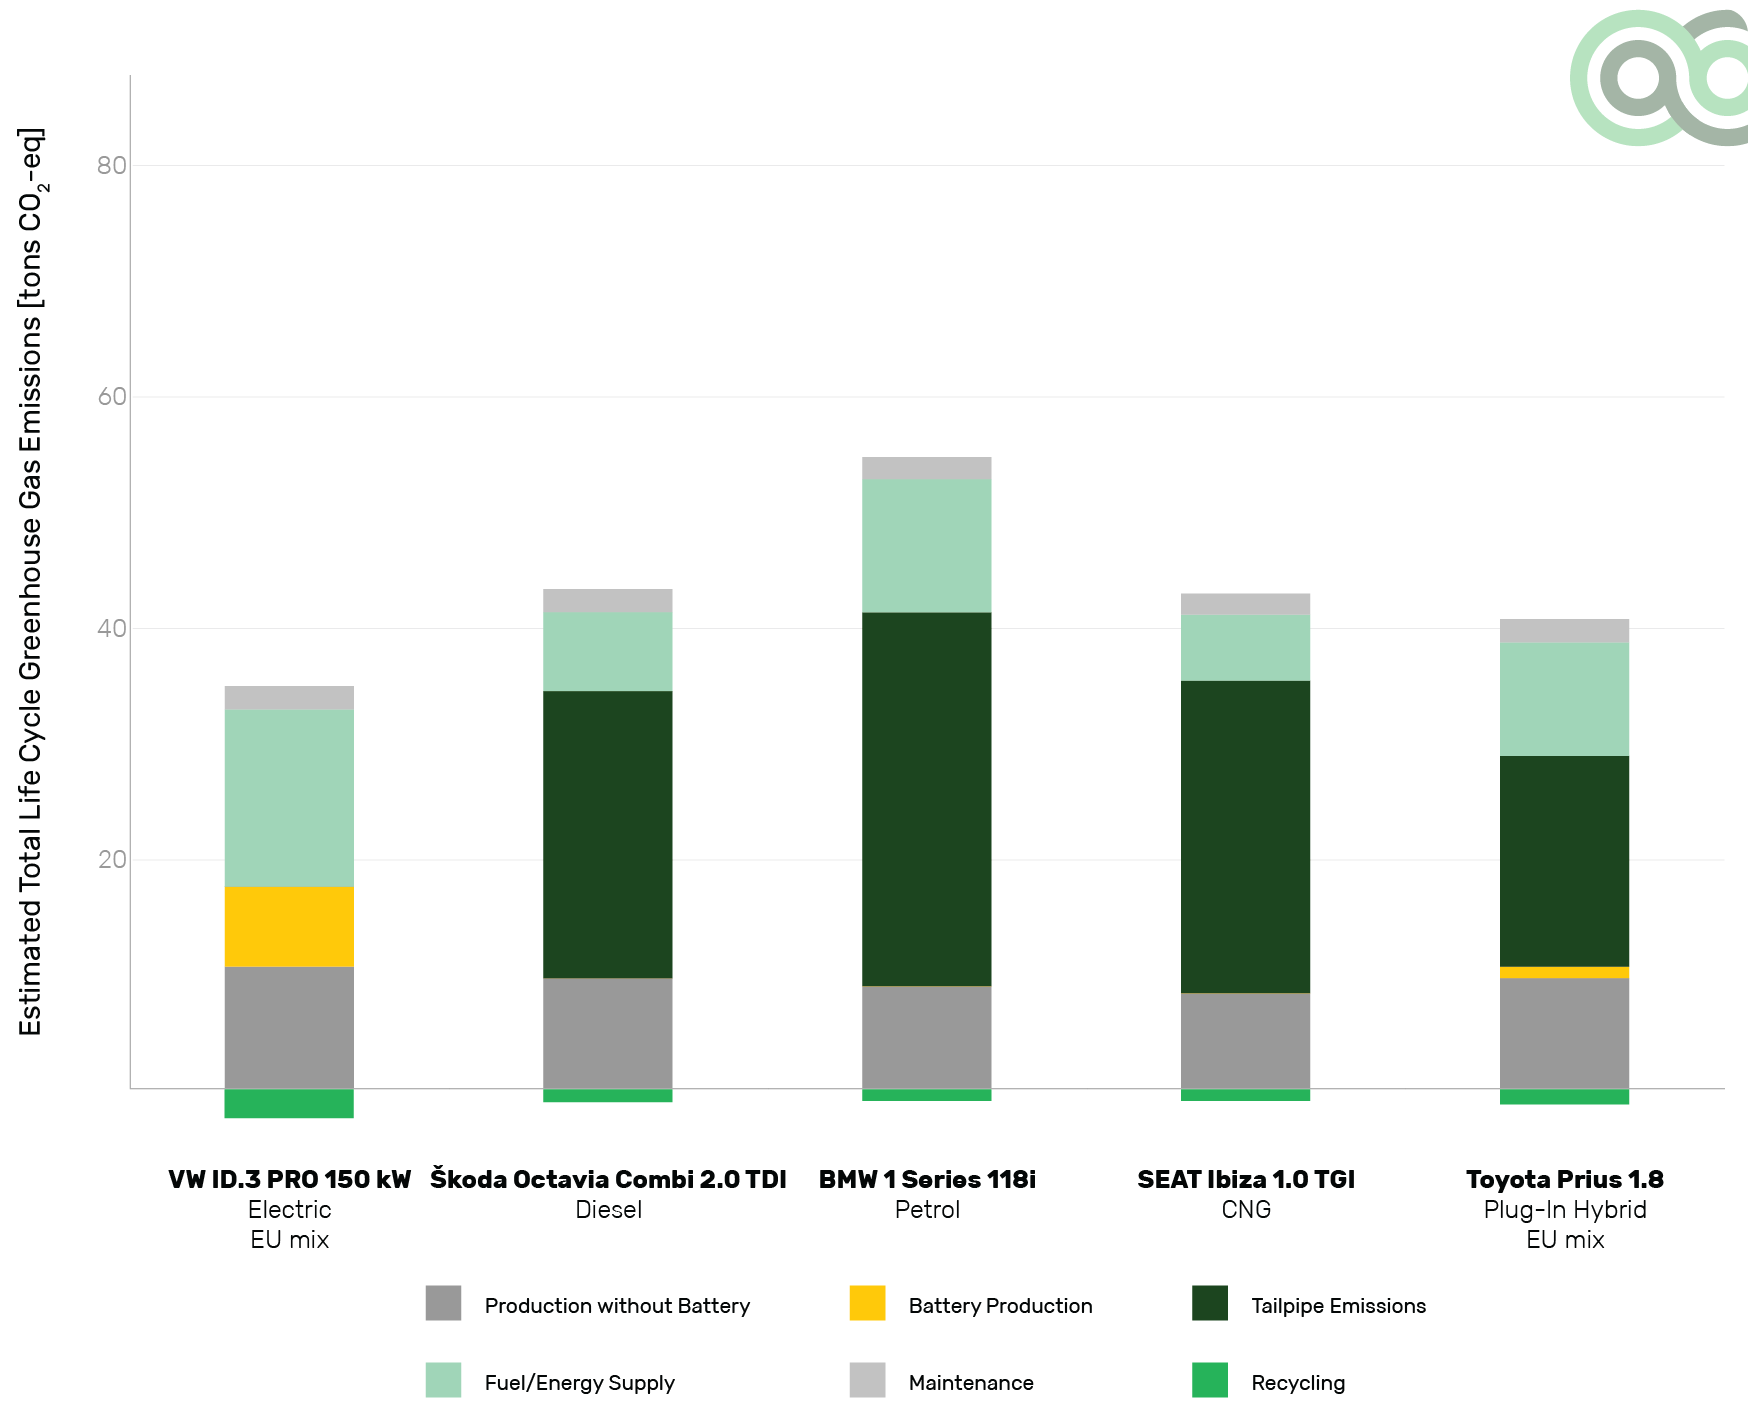
Comparing vehicles of similar mass/size and body shape but with a different powertrain, the above figure shows that, while the electric vehicle does not produce any local emissions while in use, its production – including all the electrical and electronic components and the high voltage battery that went into it – is projected to already generate a significant quantity of greenhouse gases (GHG). Adding the estimated GHG emitted in supplying the electrical energy over its lifetime brings the life cycle emissions close to the range of some of its combustion-engined competitors. Nevertheless, the electric car still shows the best overall result, especially when the benefit of recycling of electric components is added. This comparison of cars also confirms that the petrol vehicle has a disadvantage compared to the diesel one, due to its higher fuel consumption. Overall, the CNG and the plug-in hybrid cars give similar life cycle results around 40 tons CO2-equivalent. Clearly, despite the relatively low GHG emissions from fuel production, all vehicles with a combustion engine experience a drawback due to the CO2 that is being released when the fossil fuel is combusted.
Example 2: Vehicle mass
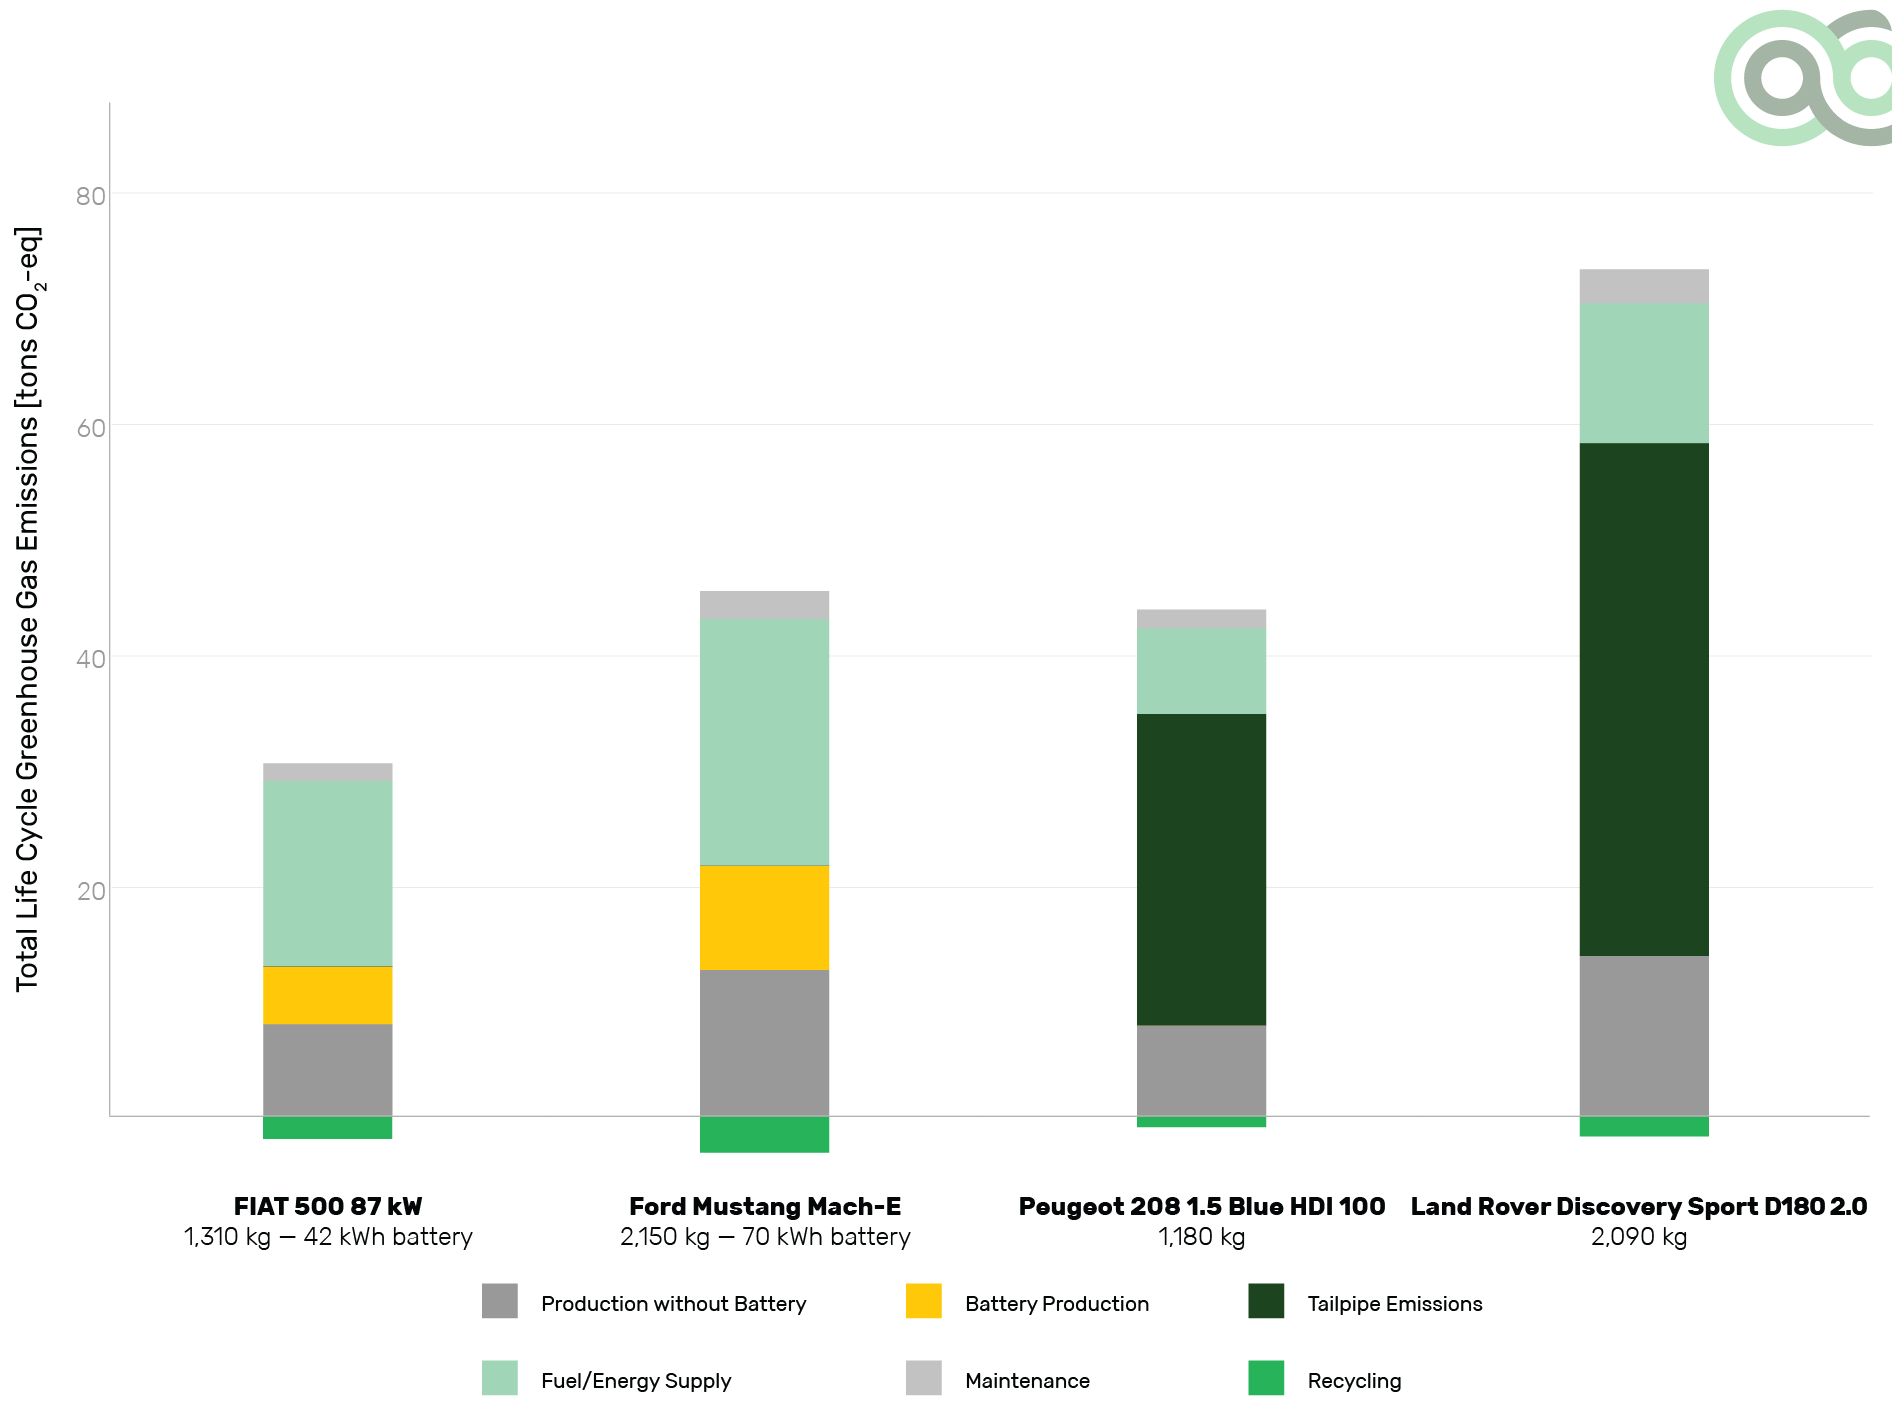
It is well known that accelerating a light vehicle takes less energy than accelerating a heavy one, so a reduction in vehicle mass can help reduce the impact on the climate. LCA can provide useful insight into the influence of mass on the estimated vehicle’s greenhouse footprint. To illustrate this, the above figure compares the life cycle greenhouse gas emissions of electric and conventional vehicles of different mass and size. Larger vehicles, despite often offering higher transport capacity and utility value, need more electricity or fuel and the higher the energy consumption is, the greater are the greenhouse gases emitted in supplying the required energy. While it is true that electric powertrains are highly efficient and the ability to recuperate kinetic energy mitigates the energy losses, the impact of mass remains obvious. The LCA analysis also highlights the increased contributions of the production of a heavier chassis, and bigger high voltage batteries to the estimated greenhouse gas output. Finally, consumers should not underestimate the overall magnitude of the estimated total life cycle greenhouse gas emissions by cars. For instance, the new electric Fiat 500 is expected to emit almost 29 tons, which means that over its lifetime, charged with the European electricity mix, even this small, efficient electric vehicle causes GHG emissions of 22 times its own mass!
Example 3: Usage conditions
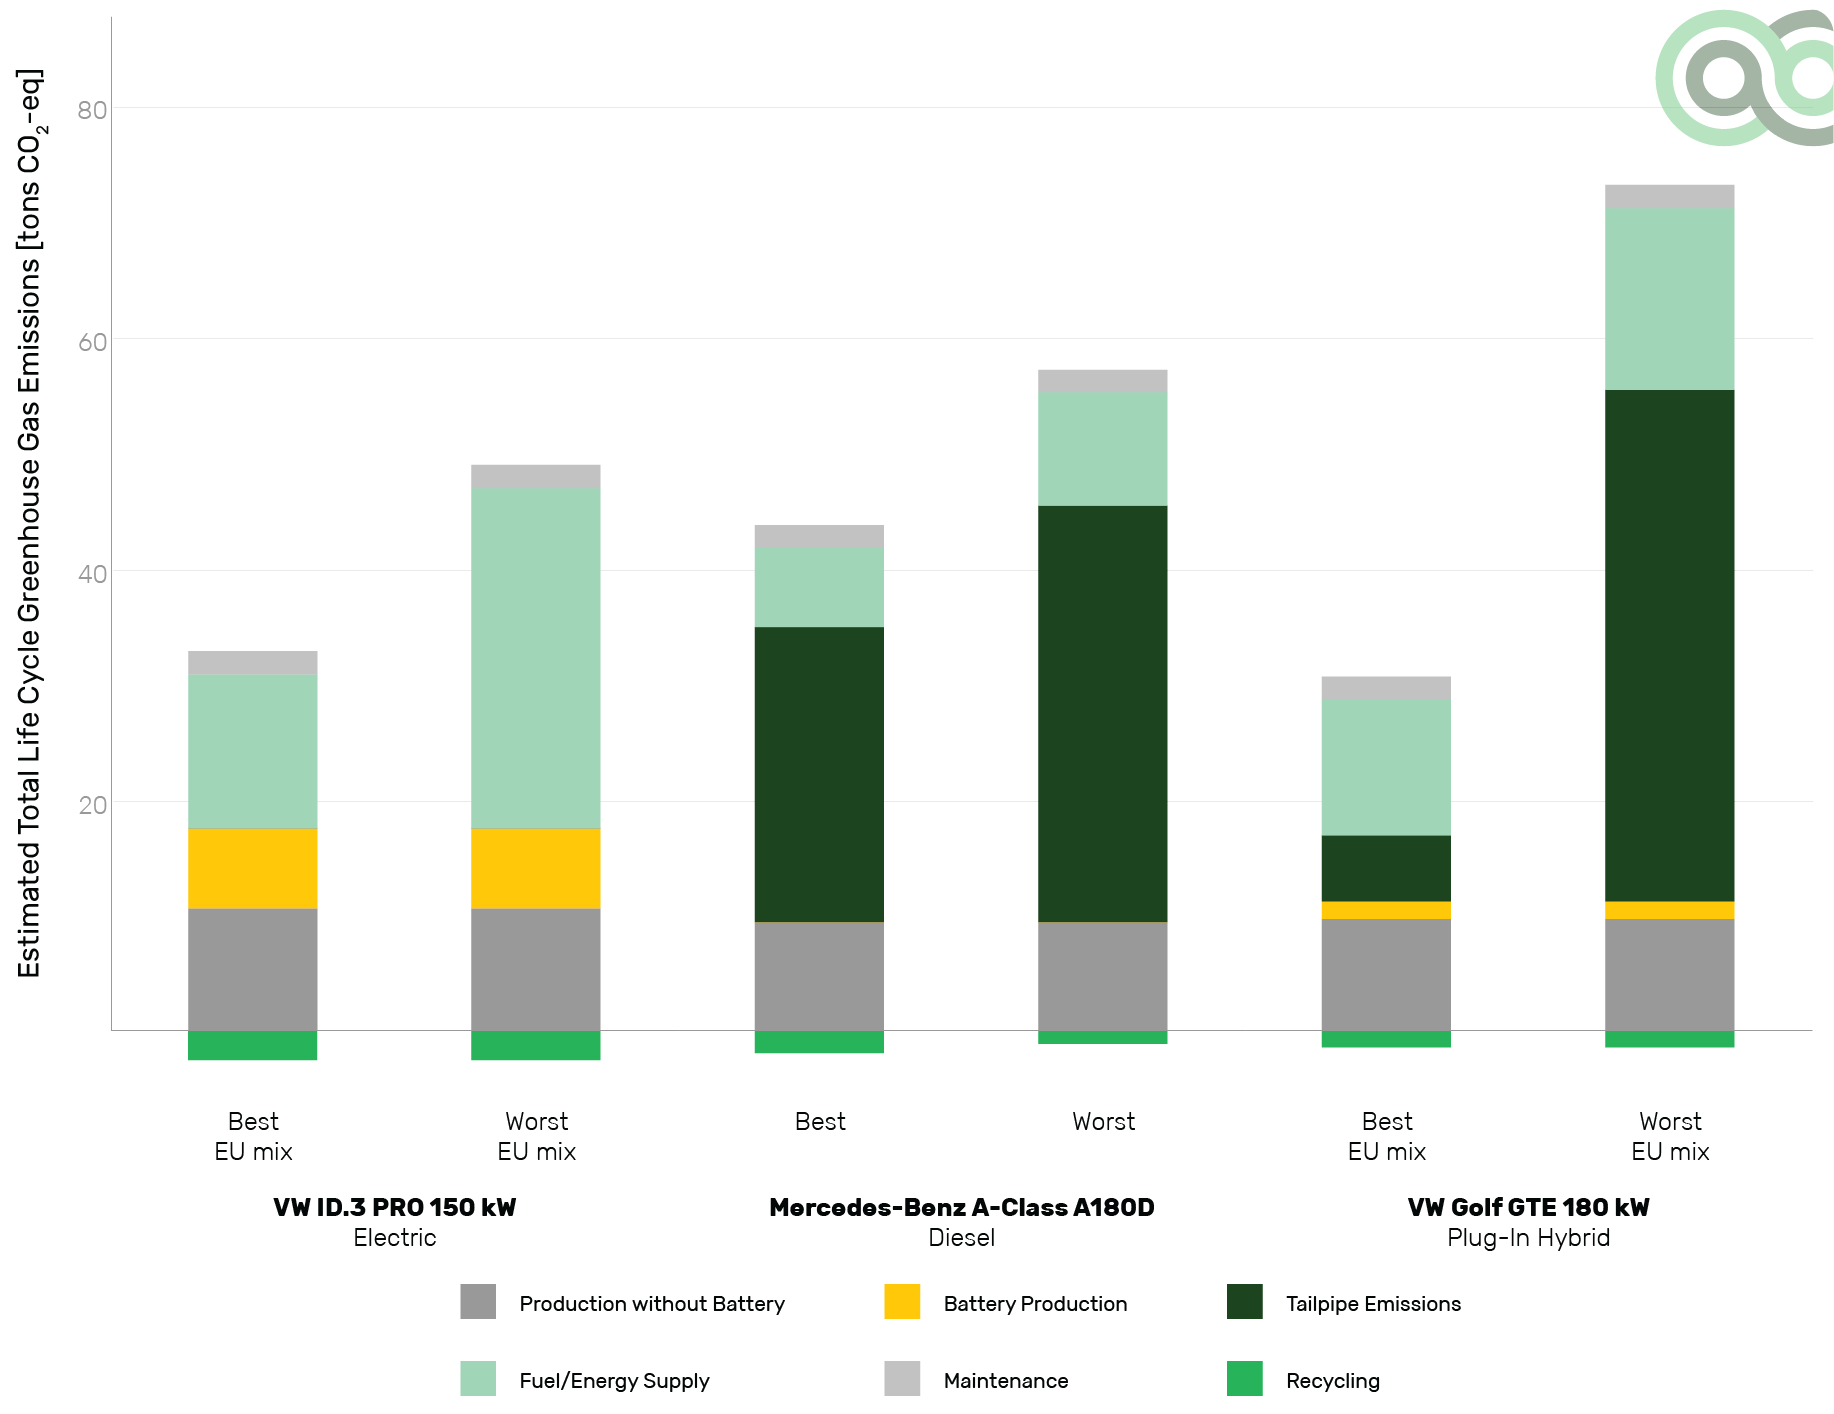
A unique feature of Green NCAP’s life cycle assessment is the ability to calculate results based on real fuel/energy consumption results, measured in different tests of the Green NCAP programme – from energy saving eco-friendly driving behaviour to demanding, high power or cold weather test cycles. While other LCA methods simply present the results assuming the officially declared consumption values, Green NCAP can accurately differentiate between a best, average and worst-case use. As can be seen in the figure above, the influence of the fuel/energy consumption on the greenhouse gas emissions from the operation phase of the life cycle (fuel/energy supply and tailpipe emissions) can be considerable. In this example, in a test at -7°C the electric vehicle consumes more than twice the energy than it does in the best case. While the relative differences are not that high for the diesel car, the difference between best and worst case are especially stark for the plug-in hybrid vehicle. Here, not only driving style and the ambient (weather) conditions matter, but also the state of charge of the battery. In the best case, the vehicle starts with a fully charged battery and is operated in an energy saving manner under normal ambient conditions, whereas in the worst case it is driven at -7°C with an empty battery. Hence, to reduce their greenhouse gas output and the effect on the climate, plug-in hybrids need to be charged regularly.
Example 4: Primary Energy Demand
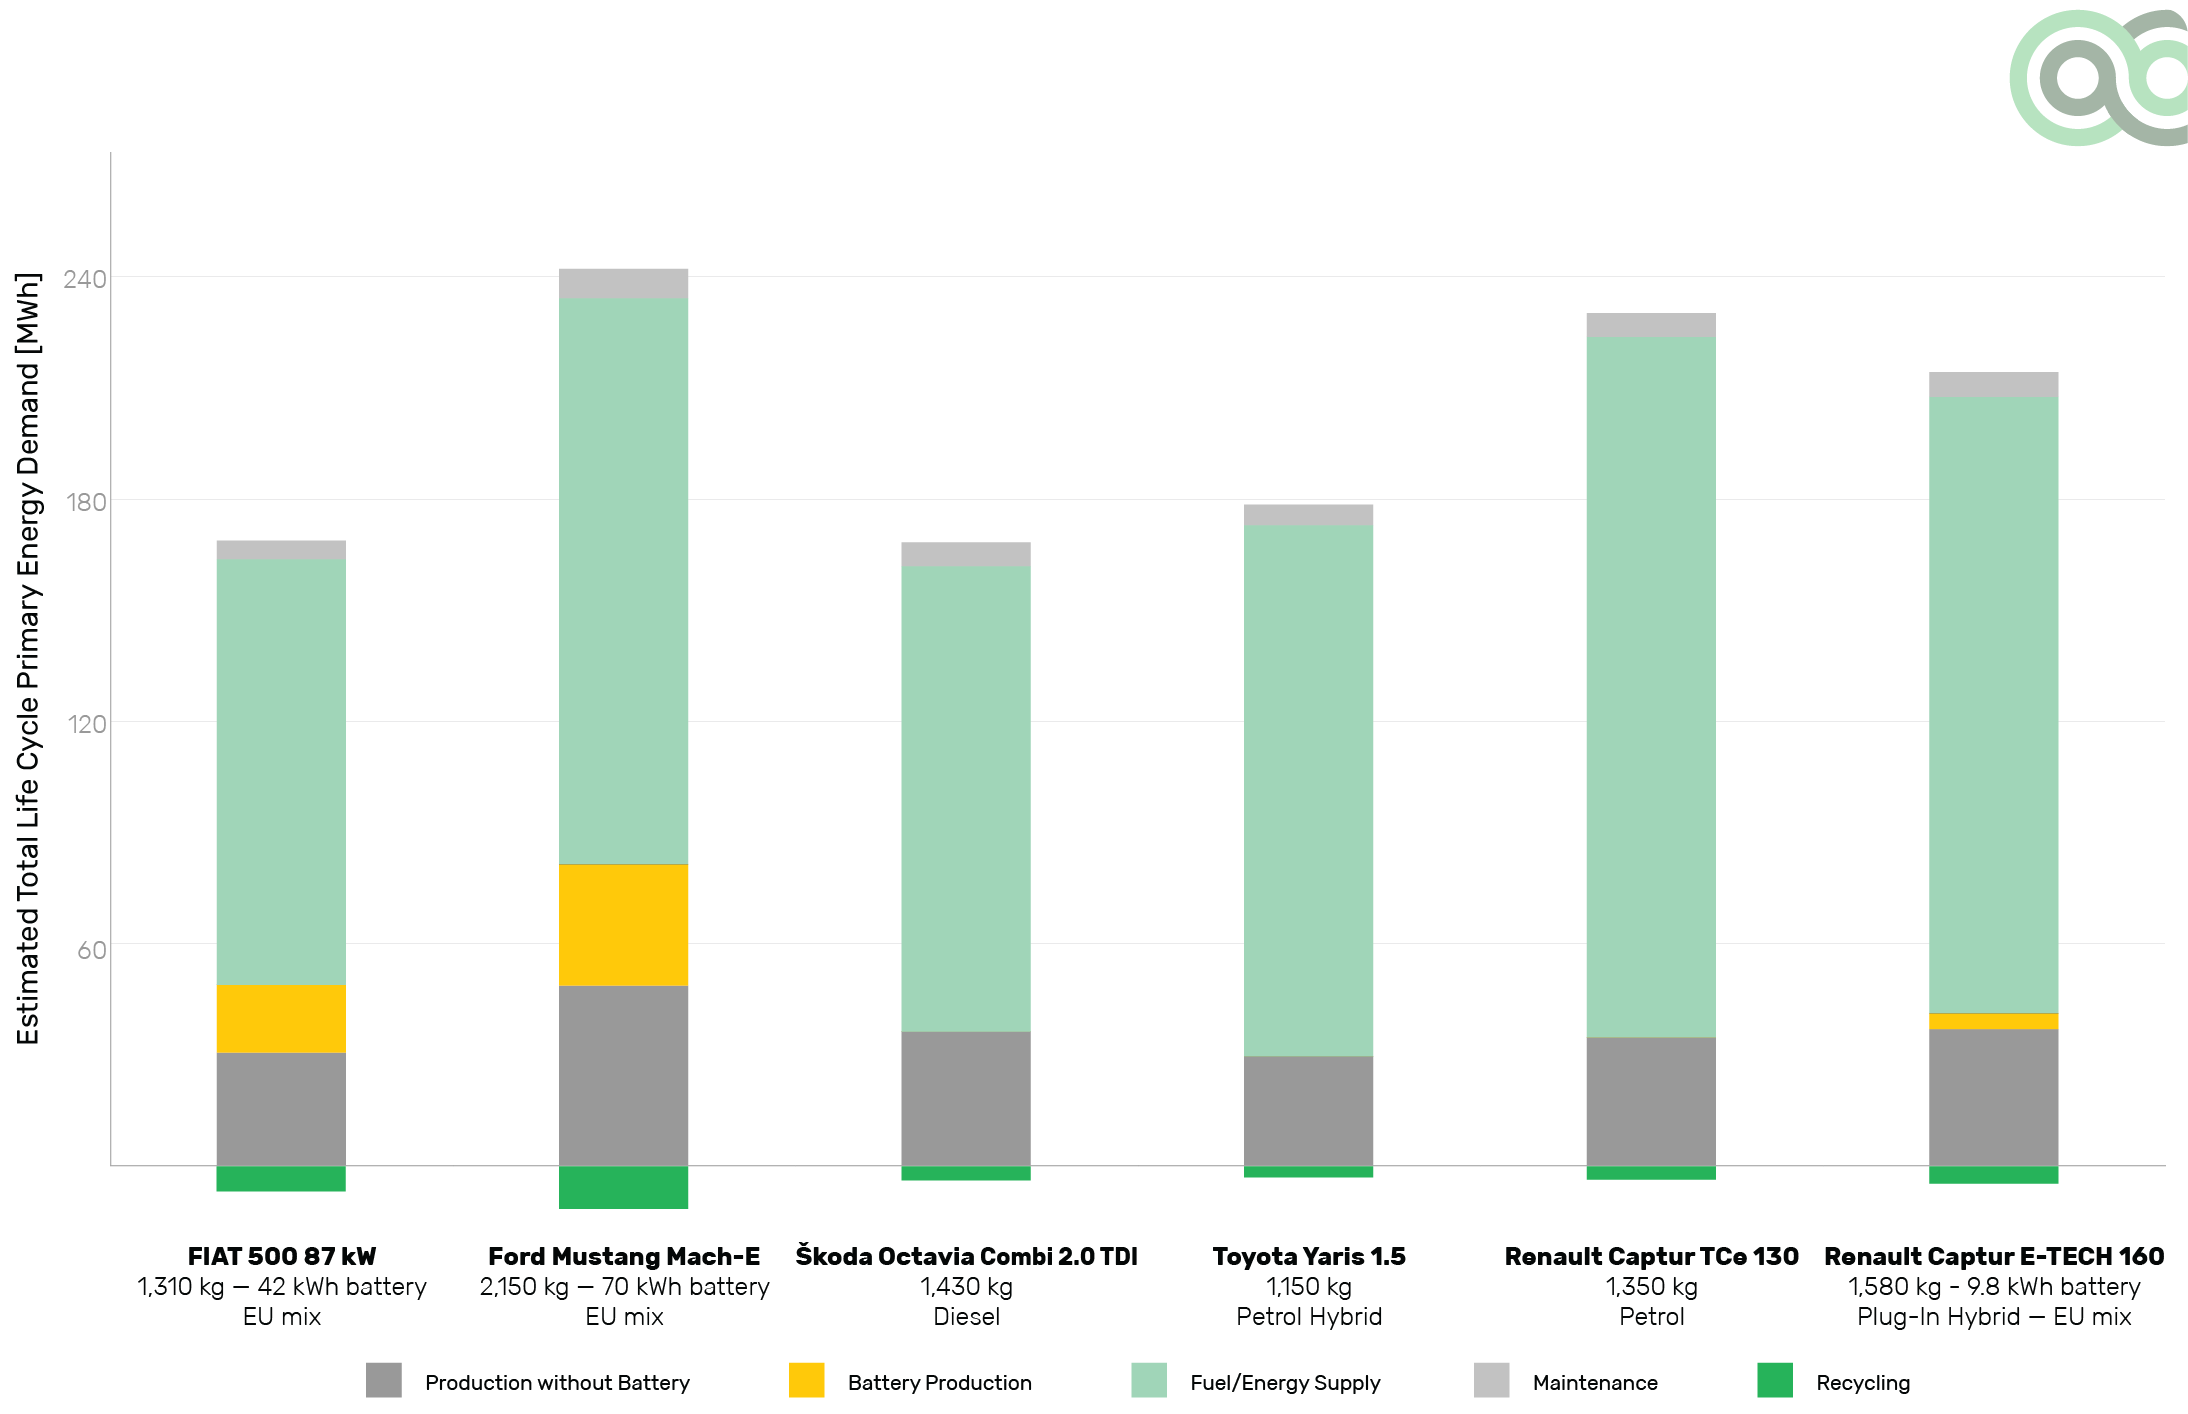
Green NCAP’s Life Cycle Assessment places the same importance on the Primary Energy Demand (PED) as it does on the emissions of greenhouse gases. PED represents the sum of all primary energy extracted from nature to provide the transportation, including coal, oil, natural gas, hydro energy, wind, waste, solar and nuclear energy. As energy supplies are scarce and valuable, they should be utilised wisely and the efficiency of all processes in a vehicle’s life cycle maximized. The figure above shows that in its life cycle a large electric vehicle needs a lot more energy than a small one and that an electric vehicle in general may have similar or even a higher primary energy demand than a comparable conventional car. The best results in this example are obtained with the small electric Fiat 500, with an estimated total life cycle primary energy demand of 162 MWh. The conventional diesel family vehicle, the Škoda Octavia Combi 2.0 TDI, follows closely with 164 MWh. Still, for comparison, these numbers equal the yearly electricity demand of 55 European average households. For all vehicles, the highest primary energy demand occurs in the usage phase, so the energy required to supply the energy carrier (electricity or fuel) and the consumption of the vehicles should be reduced as much as possible.
Example 5: Electricity mix

Finally, for an electric vehicle charged with the European electricity mix, a major contribution to the life cycle assessment comes from the sources used to produce the electricity that powers it. The higher the share of renewable energy in the electricity mix, the greener the electric car, and this is where your local results can be different from the European average. If a purely renewable electricity mix is assumed for the calculations, the usage phase of the VW ID.3 shows a minimal GHG impact and the life cycle estimated total is just half that of a conventional car. As shown, the high share of renewable energy used to produce electricity in Sweden grants the electric car the best performance in the European Union. But when the share of fossil energy in the electricity mix increases, so do the emissions of the supply of the energy. In Italy, the ID.3 shows life cycle greenhouse gas emissions close to the range of some conventional competitors, whereas in Poland – the European country with the highest share of coal-produced electricity – the electric vehicle has become significantly worse than comparable combustion engine vehicles. Still, using the average European electricity mix, the electric car has a greenhouse gas advantage compared to competitors with different powertrain types.